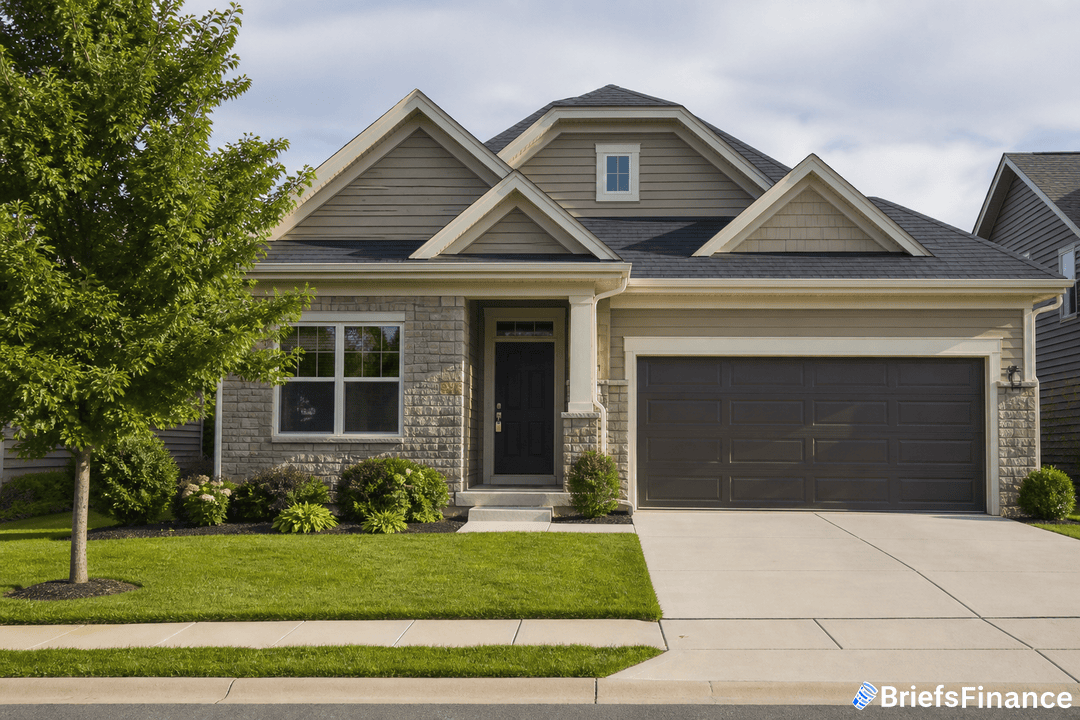
Zillow's Home Value Index reported a July reading of $371,774 for the typical mid-tier home nationwide. That figure represents a smoothed, seasonally adjusted average over the prior three months, and it applies to single-family residences, condominiums, and co-ops.
In the same report, the median number of days a home spent on the market before going pending rose to 25 in July, compared with 20 in June. This means that half of all homes that received an accepted offer in July had been listed for 25 days or fewer, whereas in June that median was 20 days.
The July valuation is directly derived from Zillow's index, which looks at properties in the broad middle rung of values within a given region. In other words, it excludes both the most affordable and the priciest slices of the market.
Zillow's index smooths out short-term volatility and provides a more stable view of typical home values.
Since home values keep climbing, get the free Always Be Buying eBook for a simple path to wealth.
The index's seasonal adjustment accounts for predictable swings in housing activity, such as the busy spring and summer buying seasons, to make month-over-month comparisons more meaningful.
Taken together, the July figures illustrate a market in transition. Home values remain historically elevated, yet the combination of rising borrowing costs and a lengthening time to pending suggests that affordability pressures are beginning to weigh on demand. The index's three-month smoothing mechanism means that no single month's reading tells the whole story, but the consistency of the upward trend in values, even as sales slow, points to a market where buyers are regaining some leverage.
The report also highlighted a notable slowdown in the pace of home sales. The longer time to pending suggests that buyers are taking a bit more time to make decisions, possibly due to higher borrowing costs or increased inventory.
Zillow's data on days to pending is a key indicator of market heat. A shorter time typically signals strong demand, while a longer time can indicate a cooling market. The shift from 20 to 25 days, while modest, aligns with broader trends of slowing home sales in mid-2026.
The gradual climb in home values has persisted even as borrowing costs have increased, contributing to a slower pace of sales. With homes taking longer to go pending, buyers are gaining more leverage, and sellers may need to adjust expectations. Zillow's smoothed index helps to highlight these longer-term trends without being swayed by short-term noise.
Dana Morgan authored the report, which went out at 9:39 a.m. on August 17, 2026.
The July data continues a pattern of gradually rising home values, even as the pace of sales cools. For buyers, the longer days-to-pending figure may offer a small window of opportunity, while sellers may need to adjust pricing expectations in a less frenetic market. Zillow's index, with its smoothing and seasonal adjustment, remains a reliable benchmark for tracking these shifts.